Straight forward uptime monitoring you can count on
Uptime Monitoring and Hosted Status Pages
- Email, SMS and Slack Notifications
- Flexible Pricing
- Built-in Status Pages
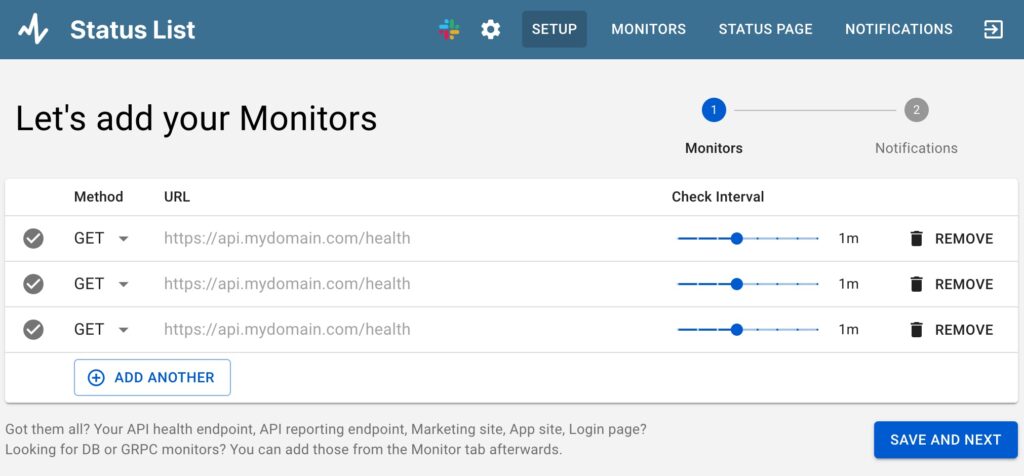
- Paste and Go Monitor Setup

We Ping Your Servers, You Get Notified... Right away!
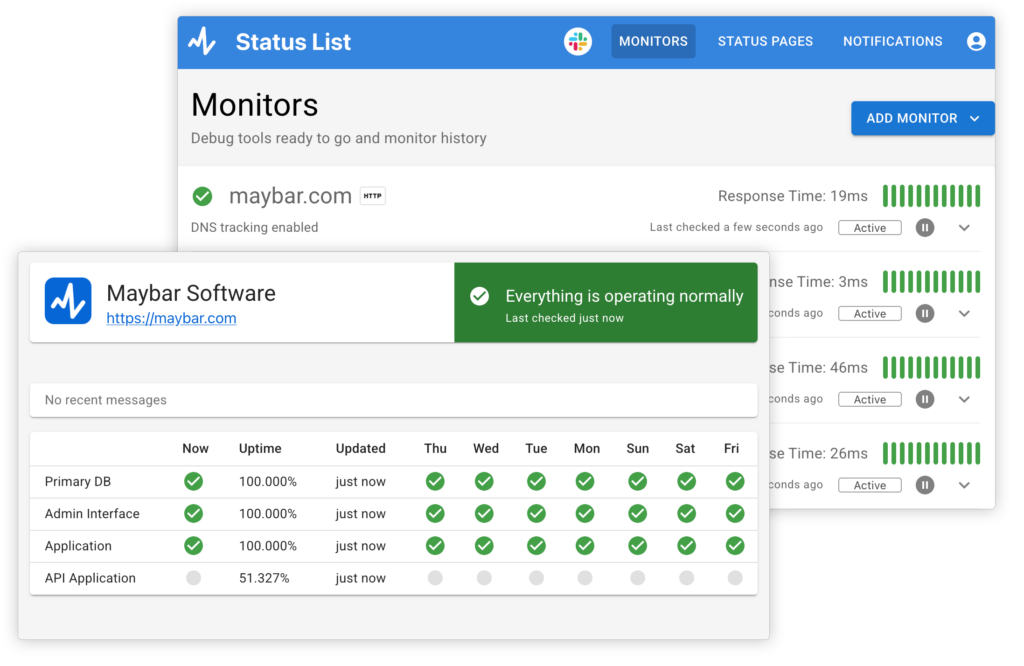
Every day, we ping thousands of servers and detect hundreds of incidents. We get it, down time sucks. We check for servers that are down or not performing well and let your team know right away!
Start with 5 monitors on our free plan or 10 monitors on our Business plan (more details, get started)
Email, SMS, Slack... you pick
Get notifications in the context your team is used to. Push them into a Slack channel? SMS to the on-call team member? No problem.
We speak HTTP, DB and GRPC
Run checks on all the systems you’re running. Status List integrates with traditional HTTP endpoints, all the major databases and even GRPC calls.
Join the thousands of happy endpoints we monitor every minute
Personalized Status Pages
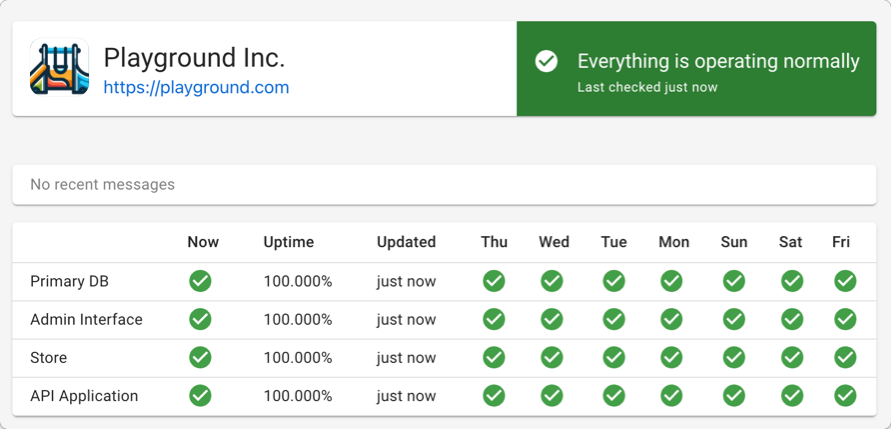
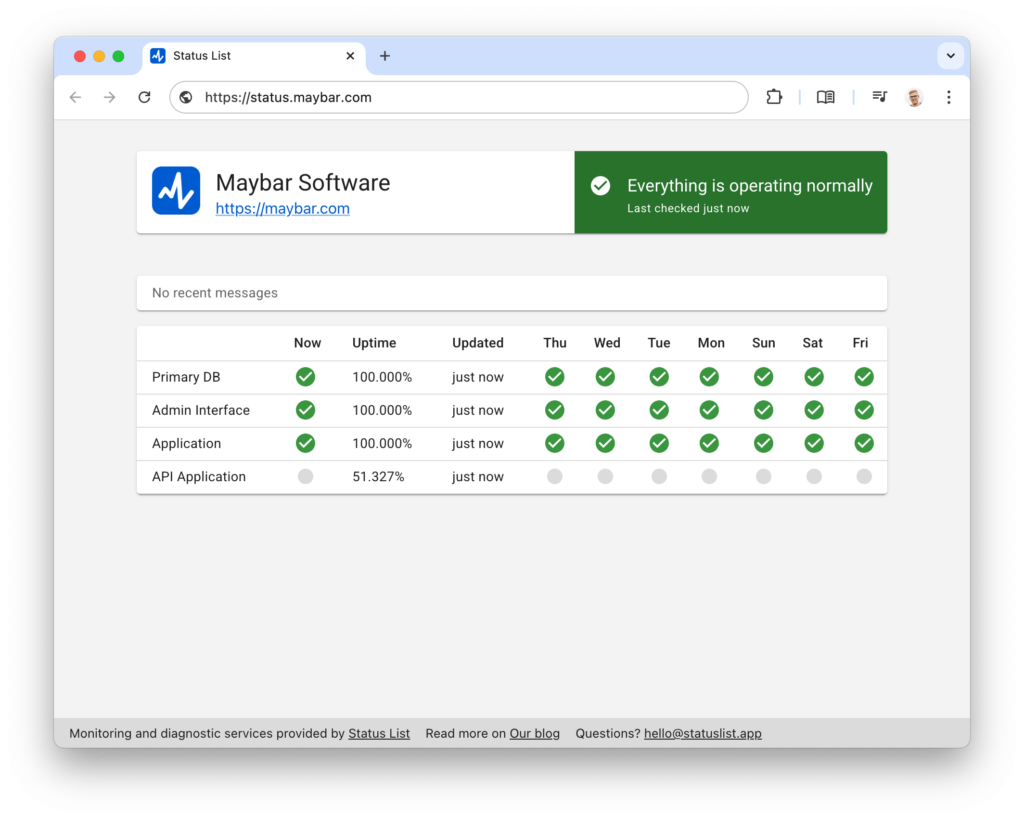
Broadcast to the world and your own team in style! Use our built-in status pages to display your uptime data.
Customize to fit you
Add your logo, company name and website link to make it yours. Style to your heart’s content to be consistent with your branding.
Bring your own domain
Use your custom domain to add that extra level of professionalism for your customers. Get that status.yourdomain.com setup today!
Served with SSL
All our status pages, even custom domains are served over HTTPS. Get that green checkmark on the URL bar with zero effort from you 🙂

Private Status Pages for your Team
Keep your private metrics, private. Create custom status pages for just your team or authenticated users to see. It’s as easy as flipping a switch.
Public Status Pages for your Customers
Keep your private metrics, private. Create custom status pages for just your team or authenticated users to see.
Setup is Super Easy (and free)
Get your free account and start monitoring today!! You can always upgrade later.
Free Plan:
5 monitors, 2.5m frequency, one status page
Business Plan:
10 monitors, 30s frequency, unlimited status pages
Lifetime Plan:
10 monitors, 30s frequency, unlimited status pages


Using Heroku?
Use the Heroku CLI to provision the statuslist:consultancy addon or head over to the Status List Addon Page


