Contents

Uptime Monitoring - Heroku Setup Guide
It’s critical that you monitor your web application for issues. When issues come up, you need to be alerted right away so you can fix it before it impacts your customers. Today we’ll show you how to get your monitoring setup with Heroku.
Prerequisites
This guide is for Heroku hosted applications only. If you’re running on a different hosting platform, we have additional guides that you may find helpful.
Goal
At the end of this tutorial, you will have the following:
- Downtime and performance alerting via email, sms and/or Slack.
- Includes detailed diagnostic messages
- Monitor and Debug Dashboard
- Incident History
- Hosted Status Page
Provisioning the add-on
Let’s add the Status List addon to your app.
heroku addons:create statuslistThe addon has been provisioned. It’s now available to configure from your Heroku Dashboard or through the CLI. Let’s go add some monitors.
Accessing the Status List Dashboard
You can access the dashboard via the CLI:
heroku addons:open statuslistor by visiting the Heroku Dashboard and selecting your application, then select StatusList from the Add-ons menu.
After you have setup users (later in this guide), you can also login at app.statuslist.app
Setting up Your Account
When you first login, you’ll get a page that looks like this:
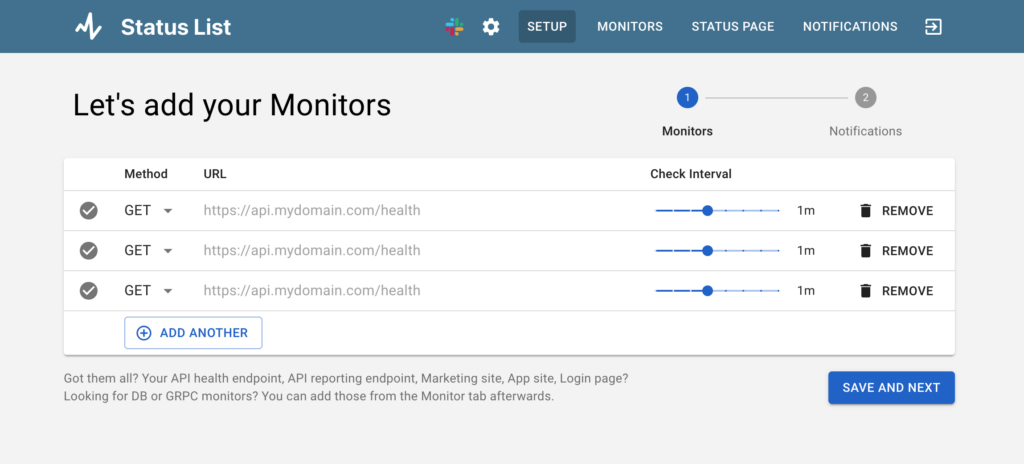
Setup Monitors
Here you can add your monitors. If you need to customize further, you’ll be able to do that in the Monitors tab after. If you don’t have any monitors ready, you can skip this step for now.
Setup Notifications
Next, you will see a spot to configure your notification alerts. You can configure email or sms notifications. Ensure you confirm your email address by clicking confirmation email.
The Monitors Section
You should now have a monitoring dashboard that looks like this:
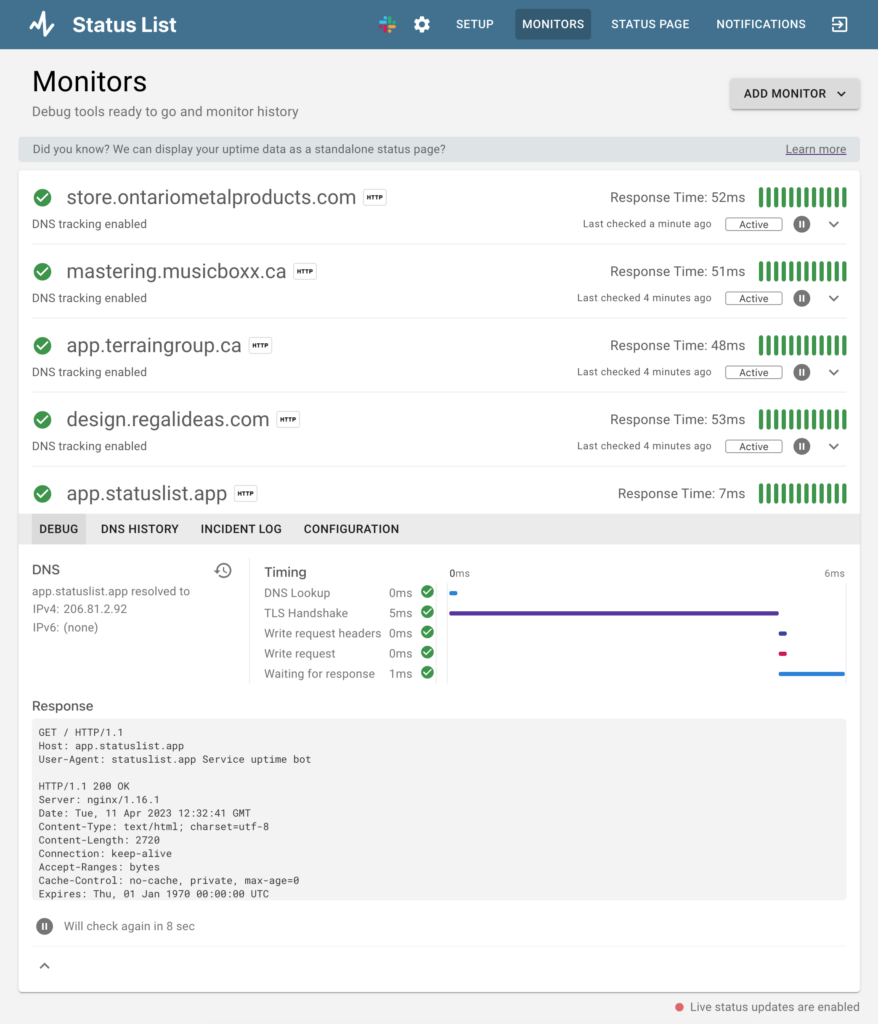
Adding Monitors
You can add monitors by clicking on the Add Monitors button on the top right. This will walk you through the steps to setup your monitor and get it started.
Advanced Configuration
You can configure advanced settings for each monitor as well. Click on the monitor and choose the Configuration sub tab. Here you can do things like:
- Change performance thresholds
- Change check interval
- Add authentication parameters
- Remove a monitor
Incident Log
The incident log automatically logs every incident this monitor has had. You can view the incidents and their HTTP transcripts by opening your monitor and going to the Incident subtab.
Setup Slack
If you would like to configure Slack notifications, click on the Slack icon at the top. This will walk you through the steps on how to get things set up. You can also refer to our Slack Setup Guide for more details.
Setup Status Page
Setup your hosted status page by clicking on the Status Page header item. You should see a screen that looks like this:
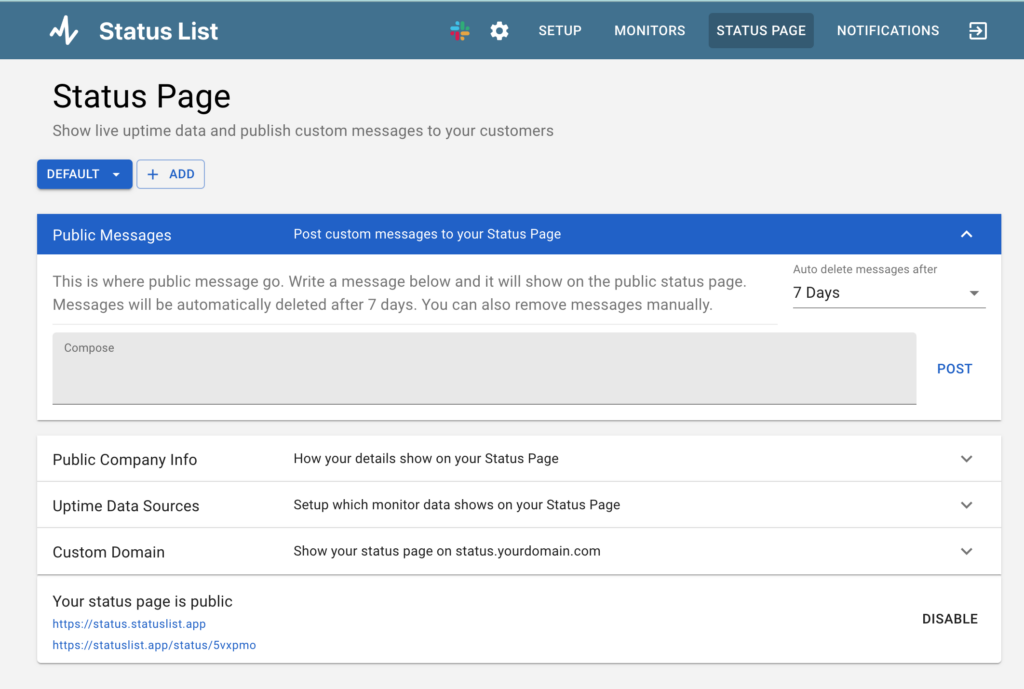
This will walk you through the steps of how to set up your hosted status page. You can see an example of a hosted status page at status.statuslist.app.
Wrapping Up
You are off to the races with your Heroku uptime monitor. If you’re using Rails as your Heroku backend, you may be interested in our Rails Health Check Setup Guide. We also have guides to set up specific technologies.