Ready to know about downtime before your customers?
Status List delivers uptime monitoring and professional hosted status pages for sites of all shapes and sizes.
Trusted by 1000+ companies

Own a website, want to get alerts when it’s not working?
Consider trying out Status List for free. We have thousands of less-stressed customers who rely on us.
NGINX is a high performance, event-based web server and reverse proxy. Many critical applications use NGINX to serve interface their content with staff and customers. It’s really important to monitor NGINX for errors and performance bottle necks. If there’s an issue connecting to your application, you want to be on top of it right away!
Before you get started, you’ll need NGINX installed and configured on your system. You can read our NGINX setup guide if you need help with that.
The built-in NGINX status page relies on the ngx_http_stub_status_module. Let’s walk through getting that module installed and enabled.
You can check if the ngx_http_stub_status_module is enabled by running the following command:
nginx -V 2>&1 | grep -o "with-http_stub_status_module"
If you see a grep match output containing http_stub_status_module, then your module is already installed and you can skip ahead.
To install the ngx_http_stub_status_module, we’ll need to re-install NGINX with the necessary modules. Most package mangers offer a nginx-full package which contains the ngx_http_stub_status_module. On Ubuntu, you can run the following command to install it:
apt-get install nginx-full
You can also re-compile from source and include the –with-http_stub_status_module parameter.
Let’s configure your status page. Open up your NGINX configuration file (usually located at /etc/nginx/nginx.conf).
Check through your NGINX config for a default_server block. If you do not have one yet, let’s create one. Paste the following block into your http configuration block.
					server {
    listen       80;
    listen       [::]:80;
    server_name  _; # catch-all domain
    root         /usr/share/nginx/html;

    # Load configuration files for the default server block.
    include /etc/nginx/default.d/*.conf;

    error_page 404 /404.html;
        location = /404.html {
    }

    error_page 500 502 503 504 /50x.html;
        location = /50x.html {
    }
}
Trusted by 1000+ companies
Next, we need to define a location block for our stub_status module. The location block will allow us define an HTTP path for our status page and restrict access.
In your default server block, add the following location block:
					location /nginx/status {
    stub_status;
}
The information on your status page is sensitive and could be used by an attacker to compromise your system. It’s important to restrict the IP addresses that can view your status page. Let’s add some allow/deny directives to our location block to lock it down.
In your status page location block add the following allow/deny lines:
					location /nginx/status {
    stub_status;
    allow 127.0.0.1;
    deny all;
}
*You may want to allow internal networks to access this page. You can do that by adding an additional line: allow 10.0.0.0/8;
Let’s apply your changes and make sure everything works correctly. Save your NGINX config file.
Before we restart the NGINX server, let’s test our configuration to make sure we didn’t make any mistakes. Run the following command and fix any syntax errors:
nginx -t
Once your configuration passes the tests, let’s restart the NGINX server to apply the changes.
nginx -s reload
There’s a few ways to access the NGINX status page. You use a web browser or a command line tool like curl.
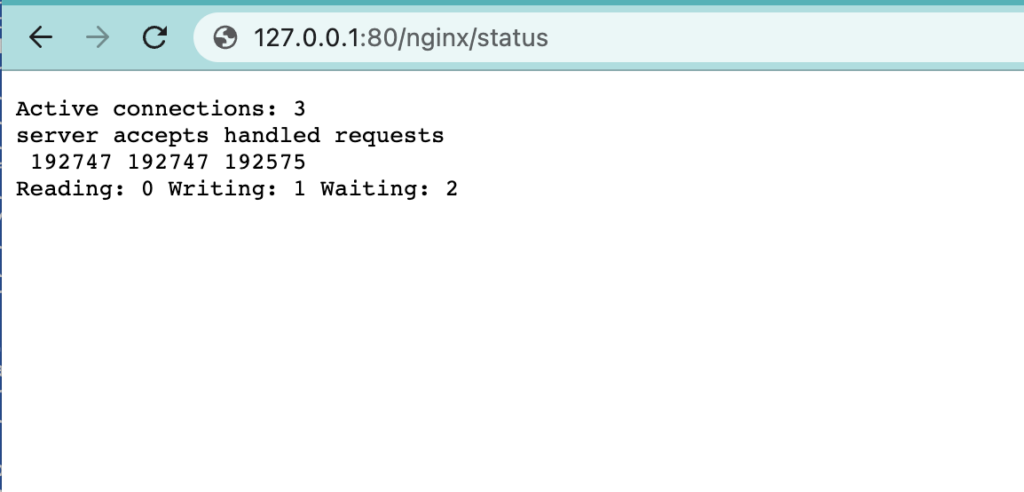
To view the status page in your browser, open a window to 127.0.0.1/nginx/status. You should see something that looks like this:

To view the status page using curl, you can run the following command:
curl http://127.0.0.1:80/nginx/status
The NGINX status page doesn’t provide very much detail other than some numbers. Let’s explore what these numbers mean.
Trusted by 1000+ companies
NGINX is a critical component in the chain of applications that make your app work. We need to monitor NGINX to know when it’s broken or degrading. Depending on your system, there are few ways to set up this integration.
Edit your nginx.d/conf.yaml file. Set the nginx_status_url parameter to http://127.0.0.1:80/nginx/status. Restart your DataDog agent and you’re off to the races!
Read more at the official DataDog docs
It’s really easy to setup an NGINX check on your uptime monitoring service.
We have our NGINX status page setup using the ngx_http_stub_status_module. We can see how well NGINX is performing under the current load independent of our other components. It’s so important to keep an eye on NGINX. It’s one of the critical components in our application. Now we know when NGINX is having trouble and we need to intervene.
If you have NGINX Plus, you may be interested in the ngx_http_api_module where you can also setup more complex status pages.
You may also enjoy our article on NGINX variables and how do complex routing.
© Status List 2026