
When the service is failing, the HTTP request/response that failed will usually give enough information to significantly narrow the issue. That’s why all of our notifications include a full transcript of the HTTP request and response. You can focus on updating configuration or repairing source code instead of wasting time trying to reproduce.
Sensitive headers like Authorization are scrubbed before the transcript is persisted in our datastore. (of course we’d rather not have that token at all!)
GET /v3/stats?aggregated_by=day&start_date=2020-01-01 HTTP/1.1
Host: api.sendgrid.com
User-Agent: statuslist.app Service uptime bot
Authorization: Bearer xxxxxxxxxxxxxxxxxxx

HTTP/1.1 200 OK
Server: nginx
Date: Thu, 21 May 2020 13:52:13 GMT
Content-Type: application/json
Transfer-Encoding: chunked
Connection: keep-alive
x-frame-options: DENY
content-security-policy: default-src https://api.sendgrid.com; frame-src 'none'; object-src 'none'

[{"date":"2020-01-01","stats":[{"met…
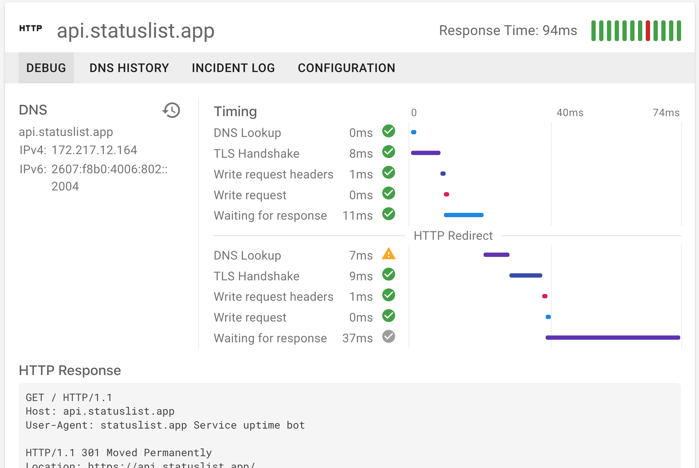
When your service is running slow, you need to know that you’re focusing on the right component of your system. No one wants to spend weeks optimizing application code when really the TLS termination is running slow. Or maybe you need to switch to a better DNS provider.
Timing diagnostics break all this down, right in the performance alert. Don’t spin your wheels in the wrong direction.
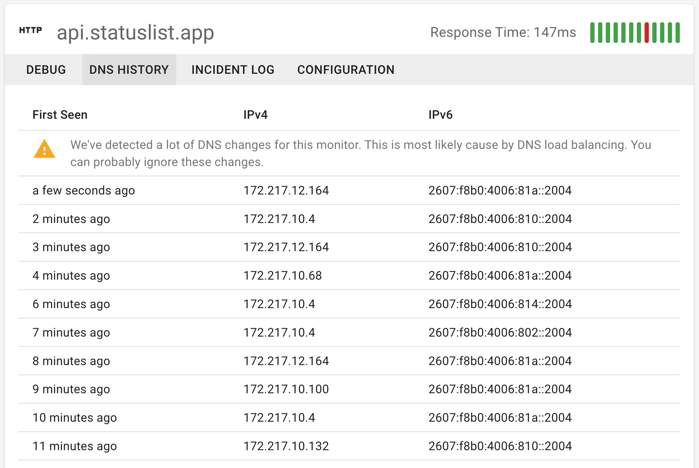
When someone changes the DNS, usually there’s no going back. If those DNS changes broke something, it can be a real headache to get things reconfigured. With Status List’s DNS tracking, we keep a complete change log of your endpoint’s DNS (both A and AAAA DNS records). That way if you need to restore to a previous value, it’s a quick lookup.
In the heat of an incident, the last thing you should be doing is recording tedious things like start/end times and error transcripts. That’s why we take care of all that automatically with incident tracking. Lookup old incidents for post-mortems or view transcript and timing details on current ones. We dig into this and more in our what to do during an incident guide.
When an HTTP monitor alerts you to a problem, there’s 100 different error sources you could check. With database monitoring, we check the most common error source before you even ask. Setup your Postgres, Maria, Mongo or Redis databases to get database uptime and performance monitoring right along side your HTTP monitors.
You can check out our guides to get started with NGINX, Apache, HAProxy and more
© Status List 2026