Contents

HAProxy Stats Page Setup Guide
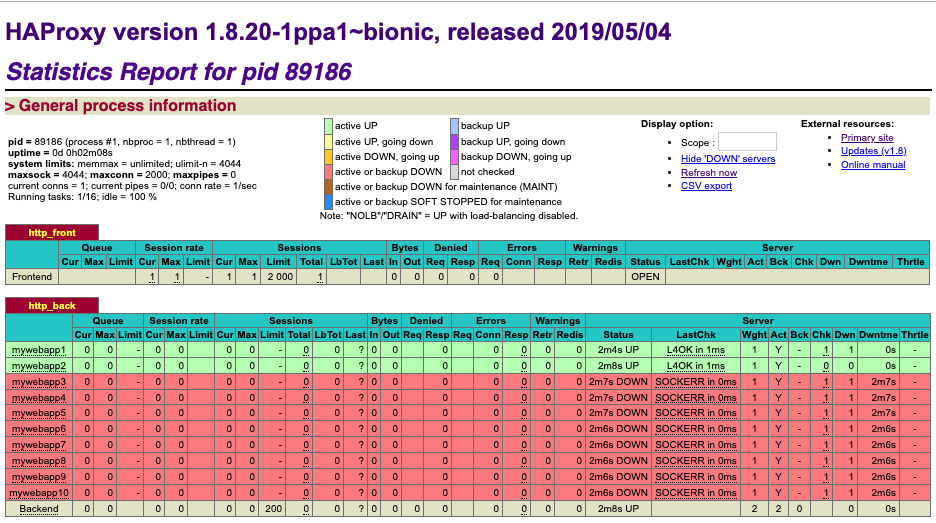
HAProxy has a dashboard that shows the current status of your load balancer. You can see metrics and statuses on specific frontends (listeners) and backends (servers). See image below for an example of what you might expect.
-
How to turn on stats page
Edit your haproxy.cfg by adding a new frontend. Enable the stats module by setting: stats enable. You can also set the uri, refresh rate and admin access restrictions with additional stats directives.
1. Enable Stats Page
Open up haproxy.cfg and add the following frontend. The stats enable directive will turn on the stats page for this front end.
					frontend stats # you can call this whatever you want
        mode http
        bind *:9000       # default port, but you can pick any port
        stats enable      # turns on stats module
        stats refresh 10s # set auto-refresh rate
2. Secure Stats Page
There are a few directives to lock down your stats page. The stats uri <path> directive moves the dashboard to a non-standard url path. This makes it difficult for unauthorized users to find your stats. The stats admin directive adds a source-ip restriction to the dashboard or a basic http authentication check. This will keep unauthorized users from accessing your stats page.
The HAProxy security directives are great, but we recommend using a firewall to block all outside access to your stats listen port. Use a jump box or something similar to give access to operations people only.
					frontend stats # you can call this whatever you want
        mode http
        bind *:9000       # default port, but you can pick any port
        stats enable      # turns on stats module
        stats refresh 10s # set auto-refresh rate
        # security
        # stats uri /stats # choose a subpath for the dashboard
        # stats admin if localhost   # enable to restrict to localhost
        # stats admin if 10.0.0.0/8  # enable to restrict to 10.x.x.x network sources
        # stats admin auth <username:password> # enable to setup basic http auth
After making your configuration changes, don’t forget to reload the HAProxy service.
3. Access Stats Page
You can access your stats page at http://load-balancer-ip:9000/stats in your web browser. You should see the stats page like the photo above. If you don’t see a stats page, there are a few things to check.
- Is the stats module enabled? See section above on how to set that up.
- Is your stats module bound to a custom port? You will need to use that port in your access url.
- Is your stats uri set to a special subpath? If so, you will need to reflect that in the URL you load up.
- Do you have network access to reach that endpoint? If you don’t have network access, an SSH tunnel may be helpful here. (e.g. `ssh -L 8081:load-balancer-ip:8081 jump-box`)
4. Setup Backend Health Checks
You may see that some of your endpoints on the stats page are grey (not checked). Those are backends that don’t have health checks configured.
Health checks are part of HAProxy’s built-in uptime monitoring. HAProxy will monitor your backends and stop sending traffic to failing backends. Failing backends will also be reported on the stats page. This is a really great feature. Let’s get it setup!
There are a few directives to configure HAProxy health checks. In your backend, add the option httpchk directive to enable http health checking. Then, add the check parameter to the end of each server directive.
					backend servers
        option httpchk # <- add this
        # before: server server1 10.0.0.11:80
        # after:  server server1 10.0.0.11:80 check
        server server1 10.0.0.11:80 check
        server server2 10.0.0.12:80 check
        server server3 10.0.0.13:80 check
Customize Health Check Monitor URI
You can customize the health check URI with the http-check send directive. Here are a few examples:
					http-check send meth GET uri /health
http-check send meth POST uri /health hdr Content-Type application/json body "{}"
Using Stats Page
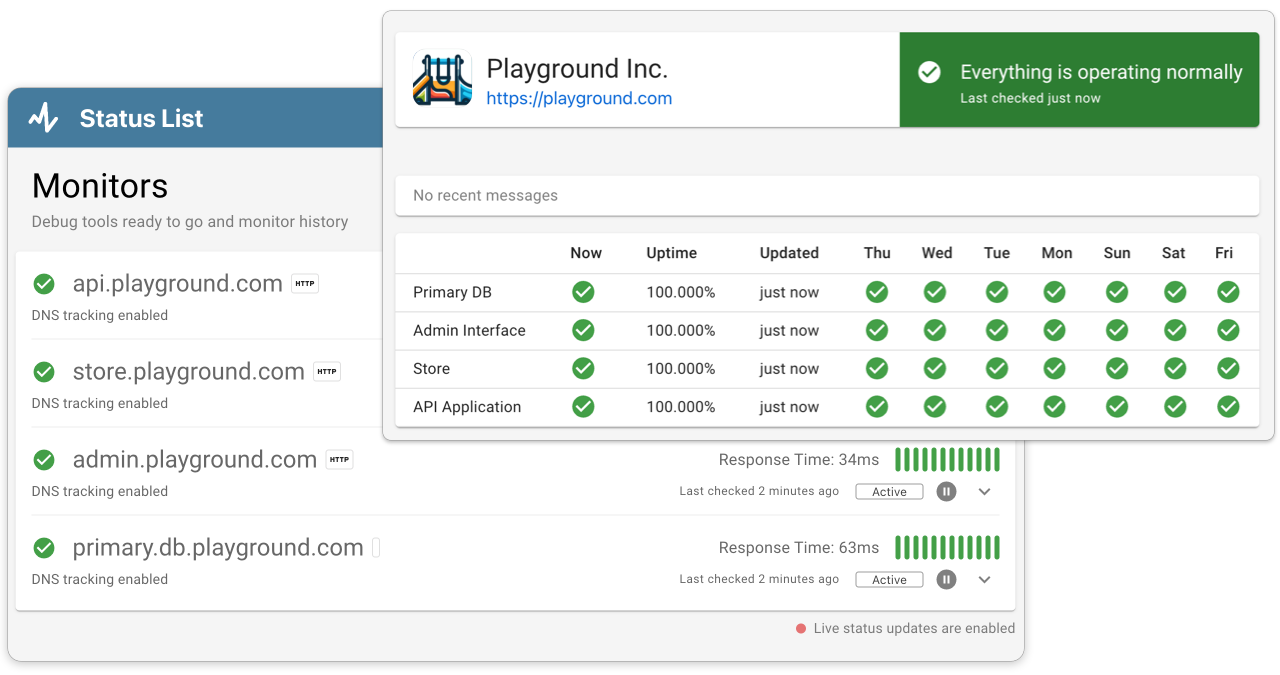
The stats page is really helpful for monitoring. This page is really helpful to have open during manual deployments, incidents or configuration changes. At a glance, you can see uptime, health check status and traffic stats.
Stats Page CSV Export
There is a somewhat hidden feature of the stats page where you can export the stats dashboard as CSV. You can access the CSV mode using this uri:
http://<ip>:<port>/stats?stats;csv;norefresh
More on HAProxy Stats
For an in depth tutorial on the haproxy stats page, check out the official docs. If you want more advanced status, you may want to check out the haproxy enterprise dashboard.
For more in depth discussion of haproxy health checks, see the official documentation.
You may also be interested in our HAProxy Stats Socket Guide which allows you to pull live data into your application or command line.