Contents

Apache Status Page: Simple Setup Guide
The Apache Status page (mod_status) is a built-in feature that displays real-time information about Apache’s performance, including the number of requests being processed, active connections, and server uptime. This page is an excellent tool for monitoring server performance and identifying issues.
To access the Apache Server Status page, you need to enable it in the Apache configuration file, usually located in httpd.conf. Once enabled, you can view the status page by navigating to http://yourserver.com/server-status. Remember to replace yourserver.com with your server’s actual domain name.
Contents
How to Setup the Apache Status Page
Add the following configuration block to your httpd.conf file:
<Location "/server-status">
    SetHandler server-status
</Location>
You can modify the /server-status value if you would like to us a different route (e.g. /status/apache).
Securing the Status Page
Before we turn on our status page, we need to secure it from the outside world. We don’t want attackers or customers seeing our internal server information. To secure our status page, we can use the Allow from directive. In the example below, we only allow clients on local networks to access our status page.
<Location "/server-status">
    SetHandler server-status
    Order deny,allow
    Allow from 10.0.0.0/8 127.0.0.1
</Location>
The Allow from line ensures that no one outside of your local network is able to access your status page. You may want to include your public ip address here as well.
Putting it all together
Now that your status page config is ready and secured, let’s publish it. Before we apply the configuration, let’s test your configuration changes for syntax errors. Run the following command to test your config:
httpd -tFix any issues that are reported before continuing.
Once your configuration is ready, restart your Apache service to apply your configuration:
service httpd restartAccessing Apache Status Page
To access the status page, open your browser and go to http://yourserver.com/server-status. You should get a page that looks like this:
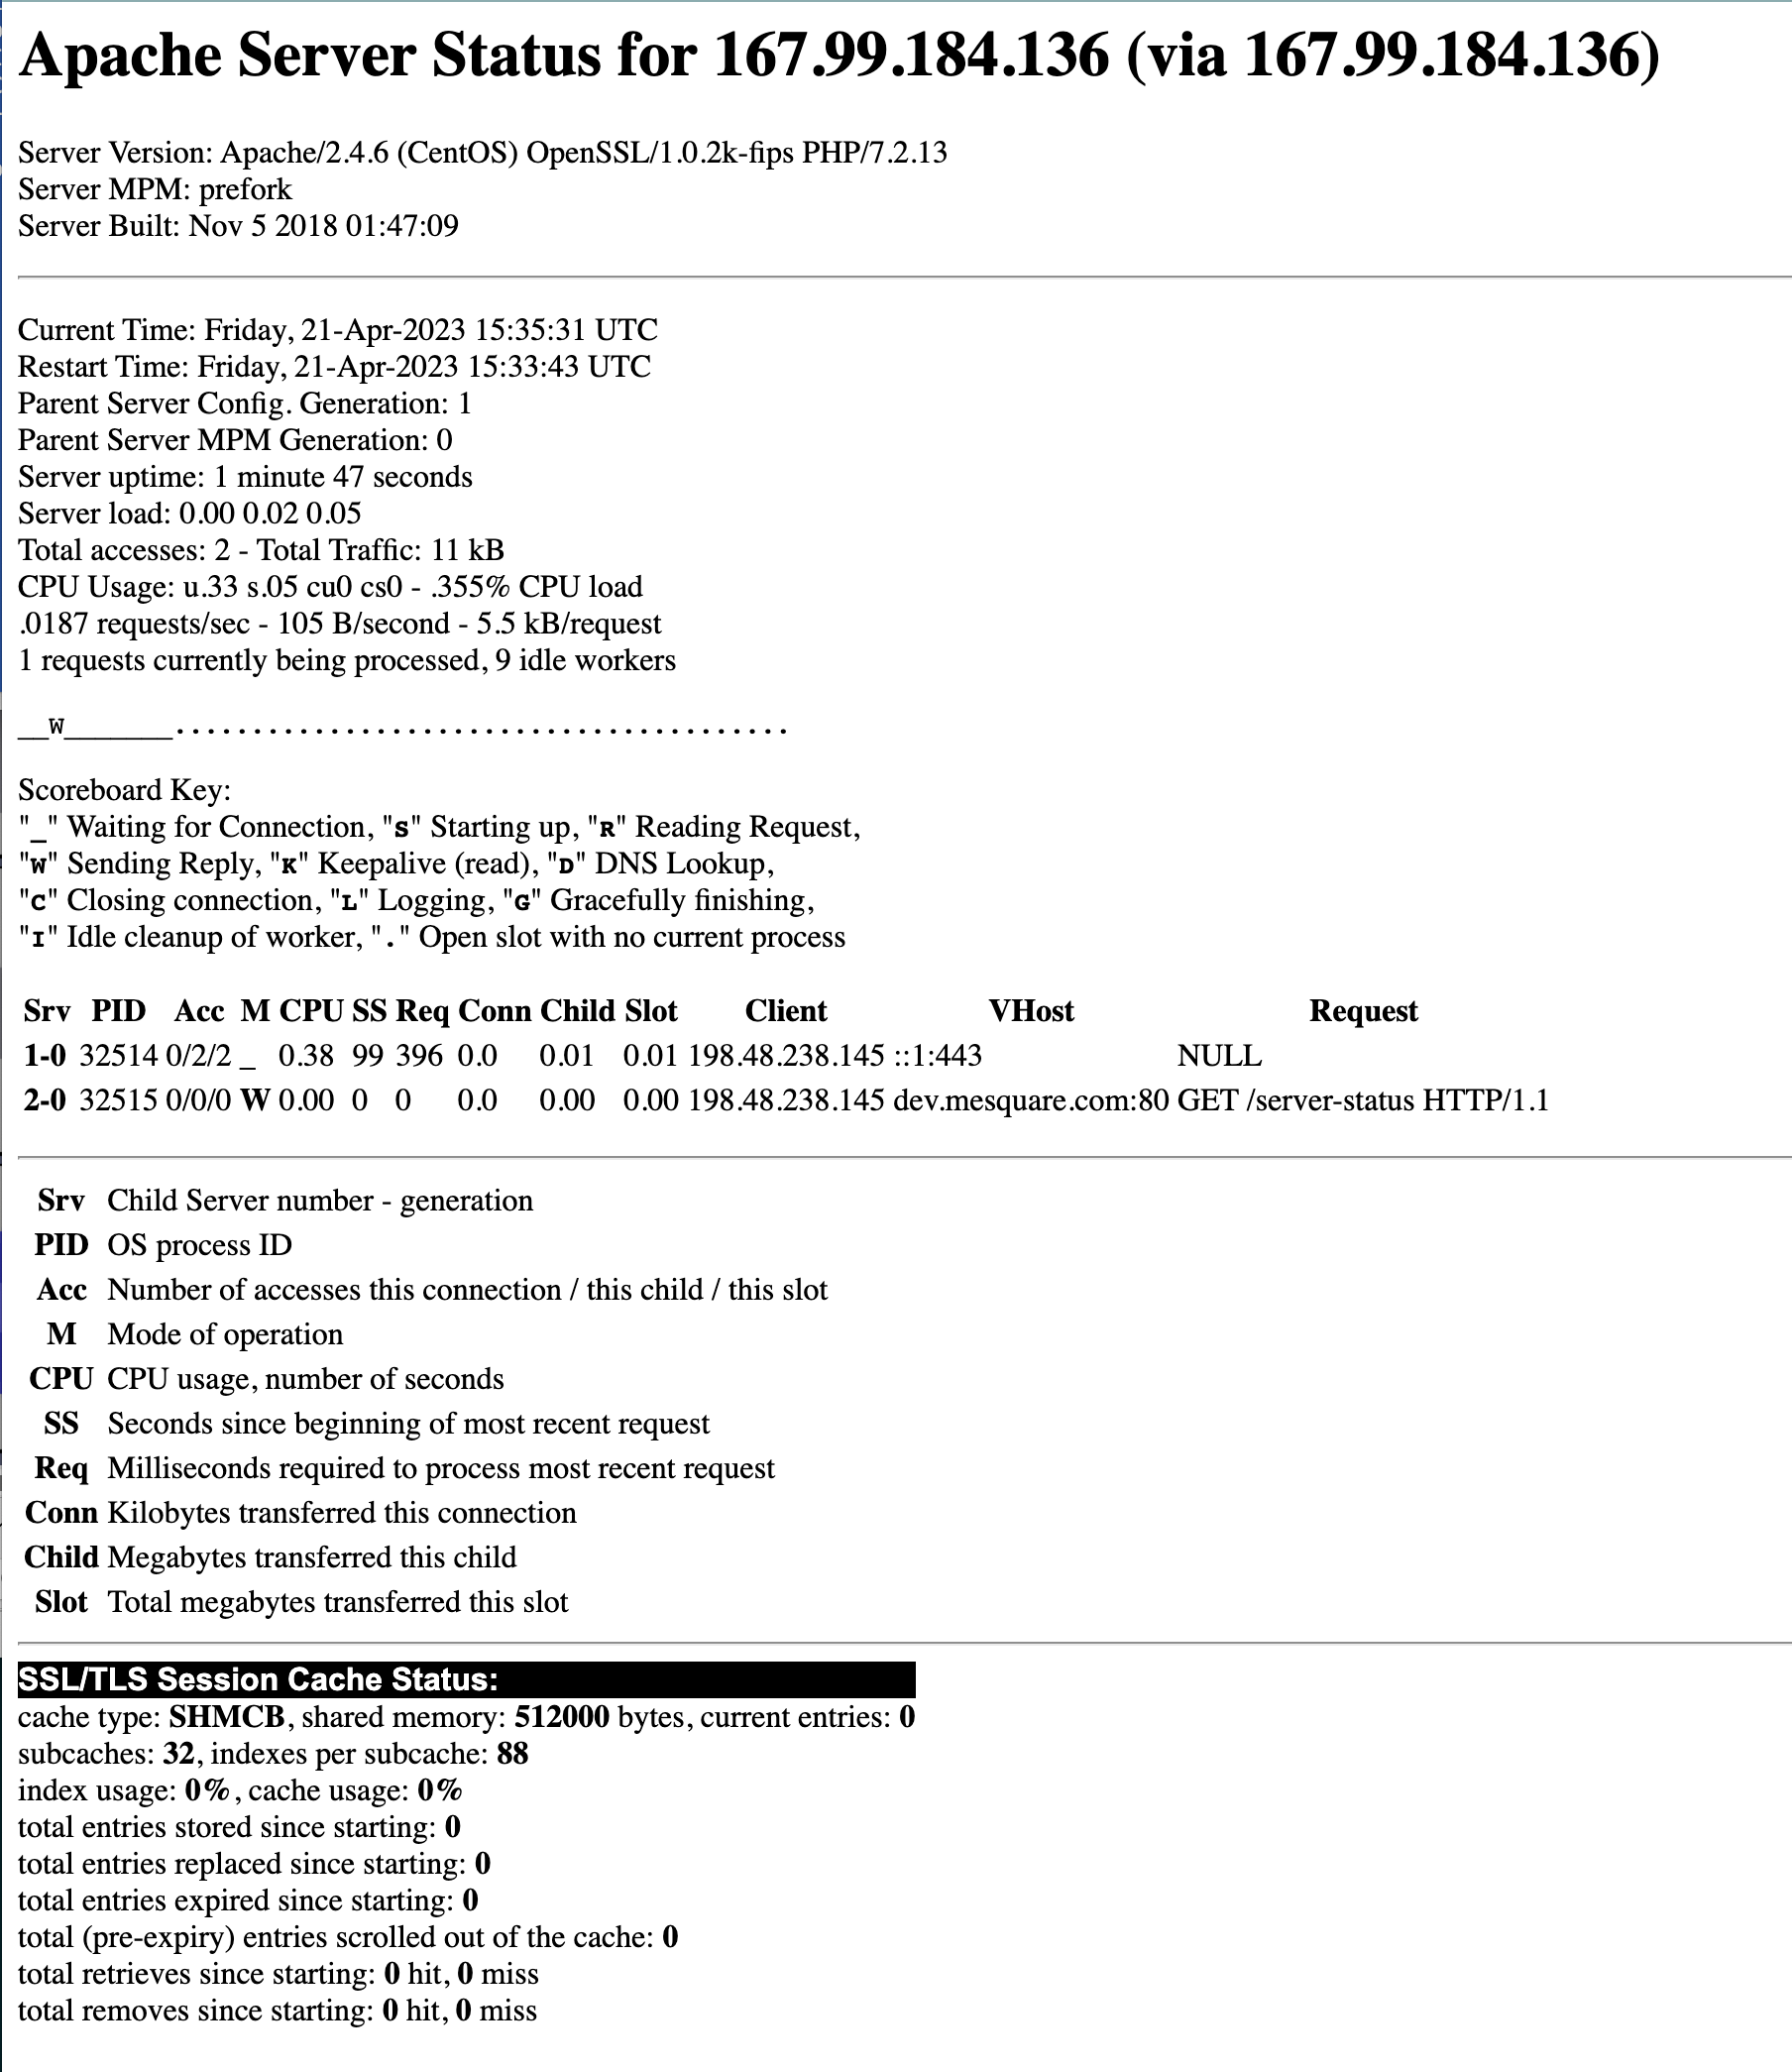
Understanding the Apache Status Page
There are a few sections to the browser-based status page. There’s a section with aggregate stats, a section of active requests and some TLS details at the bottom. Let’s dig into each section on it’s own.
Aggregate Stats
The top section of the status page has a bunch of aggregated stats. These show how Apache is performing over the long haul. This section answers questions like: Does it typically use a lot of CPU? Are there a lot of client requests coming through?
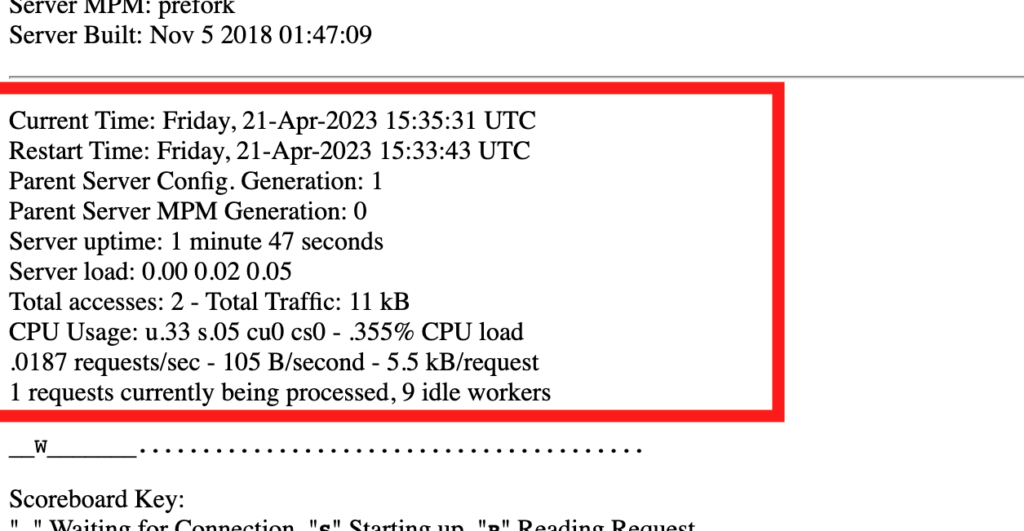
Let’s look at each parameter
- Current Time: The server’s clock time
- Restart Time: The timestamp the Apache web service was last restarted
- Server uptime: The total time that the server process has been running
- Server load: This shows the average CPU utilization of each worker since the web server was started.
- Total accesses/traffic: The total number of client requests that have been received and the total number of bytes sent to clients.
- CPU usage: This shows the average CPU utilization broken down by type (user/system) since the web server was started.
- CPU load: The average CPU utilization of all Apache processes combined since the web server was started.
- Requests/sec: The average number of requests per second since the web server was started.
- B/sec: The average number of bytes sent to clients per second since the web server was started.
- kB/request: The average number of kilobytes per client request since the web server was started.
Scoreboard
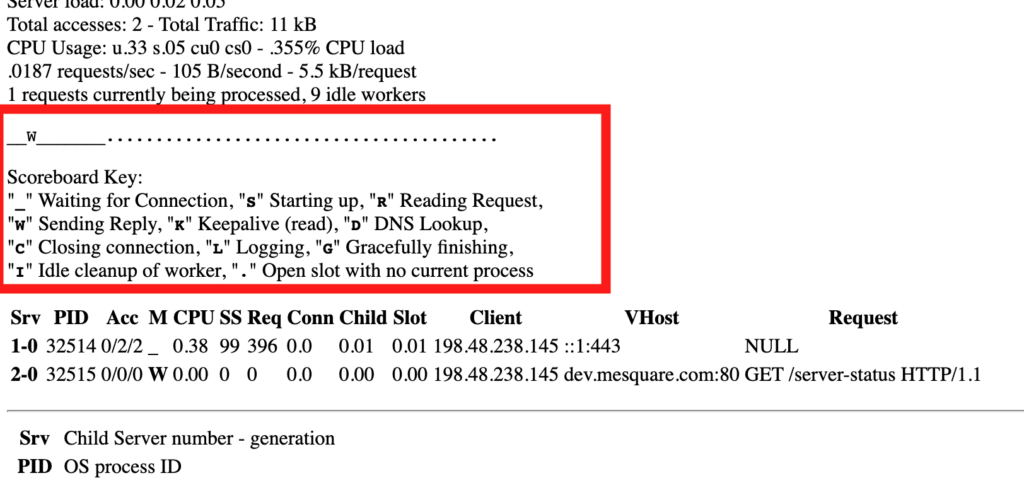
The Apache web server scoreboard is a really cool feature that shows what Apache has been up to in the last few seconds. It is so cool, we actually wrote an entire article about it: Apache Status Scoreboard Explained
Active Workers
The active workers section shows what the workers are currently doing. This is a very useful tool for debugging server load and problem areas. Here’s what the section could look like:
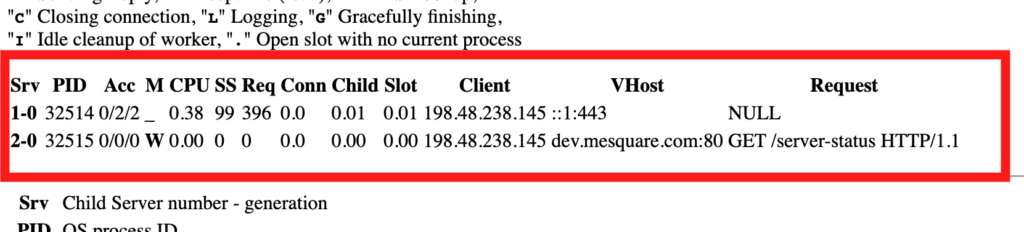
Let’s breakdown what Apache is showing us here:
- Srv: This is the worker number and version. You can mostly ignore this.
- Pid: The process identifier of the worker process. You can view this in your
ps -auxoutput - Acc: connection/child/slot:
- The number of client requests on this connection.
- The number of client requests to this worker (thread/process)
- The number of client requests to this slot. A slot is like a worker-placeholder. When there aren’t enough workers to service the current requests, the connection is linked to a slot until it can be processed.
- M: the scoreboard character for the current worker action. (see our scoreboard article for more details).
- CPU: The CPU utilization in seconds
- SS: The number of seconds since the most recent client request to this worker.
- Req: How long it took to respond to the last request (in milliseconds)
- Conn: How much data has been sent to the client on this connection (in kilobytes)
- Child: How much data has been sent to this worker (in megabytes)
- Slot: How much data has been sent to this slot (in megabytes)
- Client: The public IP address of the client.
- VHost: The host of the most recent request
- Request: The HTTP header opening of the most recent request.
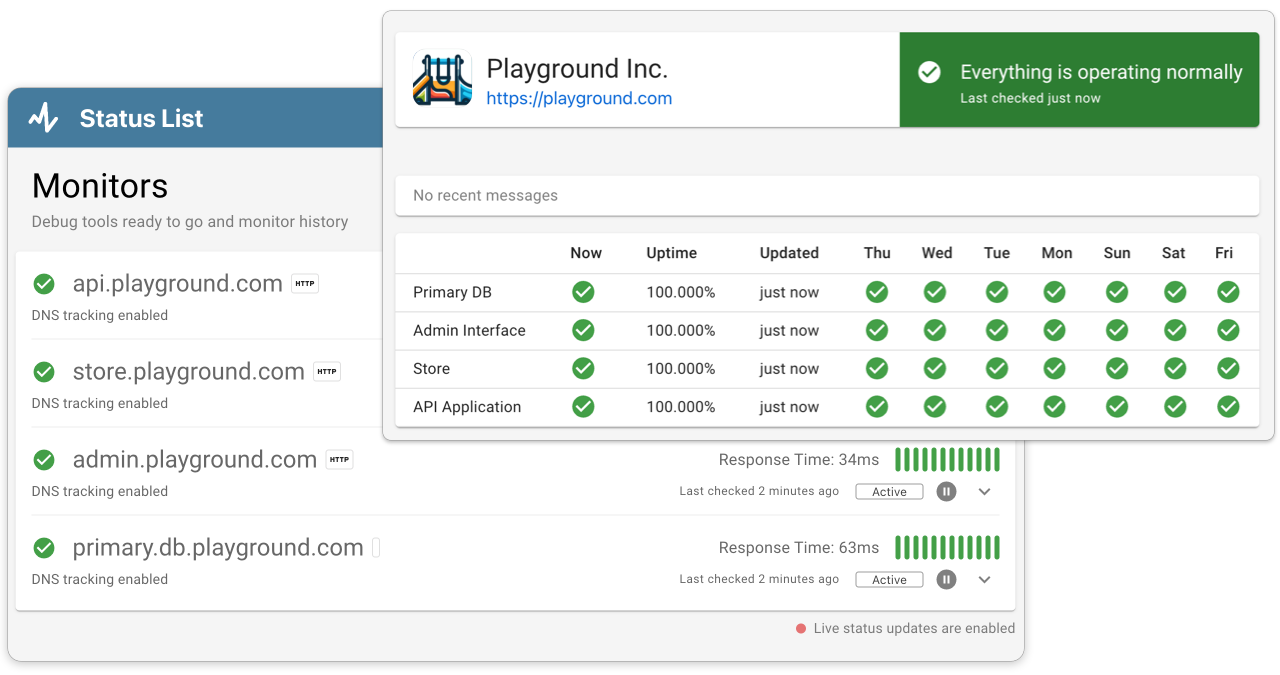
Ready to know about downtime before your customers?
Status List delivers uptime monitoring and professional hosted status pages for sites of all shapes and sizes.
Trusted by 1000+ companies
Common Issues
Status Page - 404 Not Found
You may find that your status page won’t show and you get a 404 page for your main website instead. This may be because your .htaccess file is rewriting the URL. We can fix this by telling Apache not to rewrite our /server-status route. Here’s how you can do this.
Locate your .htaccess file and add RewriteCond %{REQUEST_URI} !=/server-status before each RewriteRule. Here’s an example of a WordPress .htaccess.
RewriteEngine on
RewriteBase /
RewriteCond %{REQUEST_FILENAME} !-f
RewriteCond %{REQUEST_FILENAME} !-d
RewriteCond %{REQUEST_URI} !^/wp-admin/
RewriteCond %{REQUEST_URI} !=/server-status
RewriteRule ^(.*)$ index.php/$1 [NC,L]

# BEGIN WordPress
# The directives (lines) between "BEGIN WordPress" and "END WordPress" are
# dynamically generated, and should only be modified via WordPress filters.
# Any changes to the directives between these markers will be overwritten.
<IfModule mod_rewrite.c>
RewriteEngine On
RewriteRule .* - [E=HTTP_AUTHORIZATION:%{HTTP:Authorization}]
RewriteBase /
RewriteRule ^index\.php$ - [L]
RewriteCond %{REQUEST_FILENAME} !-f
RewriteCond %{REQUEST_FILENAME} !-d
RewriteCond %{REQUEST_URI} !=/server-status
RewriteRule . /index.php [L]
</IfModule>
Status Page - 403 Access Denied
You may receive a 403 when trying to access the status page. This is because your apache permissions are incorrect, or you are trying to access the status page from an ip address that isn’t on the whitelist. You can fix this by checking your httpd.conf Allow from method. Ensure that your public IP is enabled. (You can find your public ip here).
<Location "/server-status">
    SetHandler server-status
    Order deny,allow
    Allow from 10.0.0.0/8 127.0.0.1 <-- this line
</Location>
Putting it all together
The built-in Apache status page is easy to setup and gives you a great diagnostic tool. Once you have this setup, your team will be able to diagnose and resolve issues is record time.
If you enjoyed this article, you may also enjoy Apache Command Line Status: How To Guide or Ultimate Apache Web Server Guide.