Apache provides several command-line tools that allow you to check the server’s status, including apachectl and curl. These tools provide different levels of detail, but all are critical to maintaining a stable web service.
The apachectl command, for instance, allows you to start, stop and restart Apache cleanly. It also provides some basic status information like the current state of Apache processes. On the other hand, ab and curl commands are useful for testing Apache’s performance by generating requests and analyzing response times.
Contents
Prerequisites
In this guide we assume you have Apache web server installed your system and you are familiar with basic command line interactions.
Apache Control (apachectl) Status
One of the most common ways of checking Apache status is by using Command-Line Interface (CLI). This method allows you to access the server and run commands that will return useful information about the server’s status.
You can access Apache’s status with the fullstatus command:
apachectl fullstatusLinks Package
You may need to install the links package if you don’t have that already. On my system it was as simple as running the following command:
yum install linksAnalyzing Full Status Output
Your command line output probably looks a bit like this:
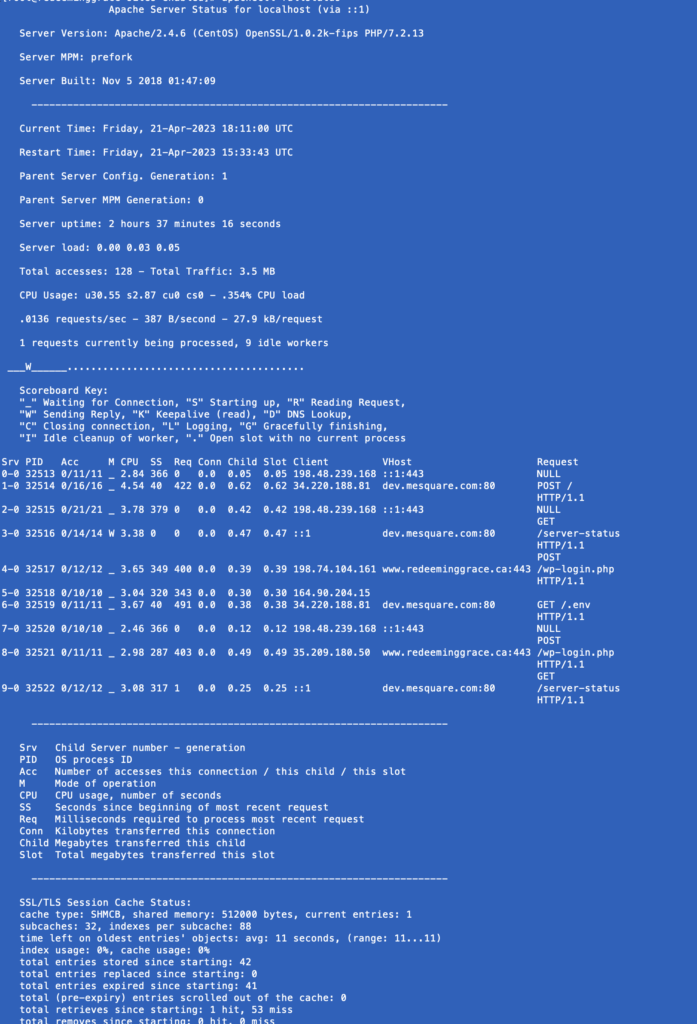
This is actually very similar to the output given by the Apache built-in Status Page. In this article, we break down each part of the output and what it means.
Using CURL to View Apache Status
You can also get the Apache Status Page for command line via curl. For this section, you’ll need to have your built-in Apache Status Page setup. If you need help getting that configured, you can refer to our Apache Status Page Guide.
In your command run the following:
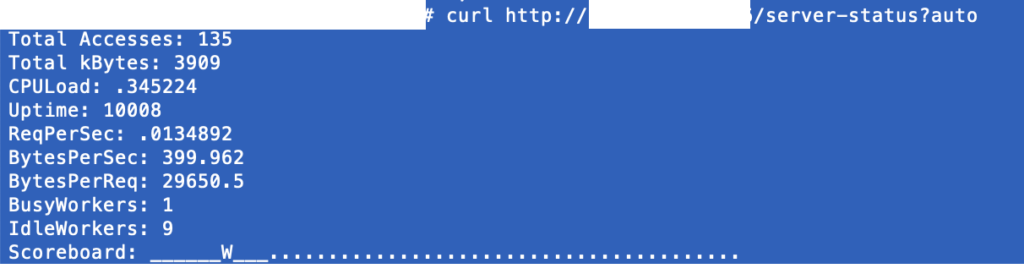
curl http://yourdomain.com/server-status?autoYou’ll note we added the auto query parameter. This instructs Apache to format the output specially for the command line. This way it doesn’t give us a bunch of HTML.
Here’s an example of what your output could look like:
Interpreting CURL Output
- Total Accesses: This is the number of client requests your apache server has handled since it was last restarted.
- Total kBytes: This is the total number of kilobytes that have been transferred to a client since it was last restarted.
- CPULoad: This is the average CPU usage (in percent) since apache was last restarted
- Uptime: The number of seconds that apache has been running (since last restart)
- ReqPerSec: The average requests per second since apache was last restarted.
- BytesPerSec: The average bytes per second since apache was last restarted.
- BusyWorkers: The number of workers that are currently working. Workers may be threads or processes depending on your configuration.
- IdleWorkers: The number of workers that are waiting for a request to process.
- Scoreboard: You can read an in-depth explanation here: Apache Status Scoreboard Explained
Putting it all together
Getting your Apache web server’s status from the command line is critical to maintaining a good web service. These tools will allow you to diagnose problems and get your service running quickly.
If you enjoyed this article, you may also enjoy Ultimate Apache Web Server Guide, Apache Status Page: Simple Setup Guide.