How to Setup Open Source ZooKeeper Monitoring
It’s critical that your ZooKeeper instance is up and running at all times. When it fails we need to be alerted. There are lots of ways to monitor ZooKeepers, but many of them are expensive and don’t give us much control. The open source tools we’re going to cover today give us the complete flexibility over our solution without the big price tag.
Let’s setup ZooKeeper monitoring with Prometheus (a popular metrics database) and Grafana (a popular visualization software). First we’re going to setup Prometheus as our data-puller, database and alerts system. Then we’ll setup Grafana to visualize our Prometheus data. Everything will operate through existing plugins. No custom code required.
- Configure your zoo.cfg
# set metricsProvider.className
metricsProvider.className=org.apache.zookeeper.metrics.prometheus.PrometheusMetricsProvider

# set metricsProvider.httpPort
metricsProvider.httpPort=7000
2. Restart your ZooKeeper instance to load the configuration changes.
3. Install Prometheus (download page, in-depth installation guide)
4. Configure Prometheus’ ZooKeeper Monitor (use your own ips in the node_ip_#).
					cat > /etc/prometheus/prometheus.yaml <<EOF
global:
  scrape_interval: 10s
scrape_configs:
  - job_name: zookeeper-monitor
    static_configs:
    - targets: ['<node_ip_1>:7000','<node_ip_2>:7000','<node_ip_3>:7000']
EOF
5. Restart your Prometheus service to load the configuration changes
6. Open http://<prometheus-ip>:9090/graph to check that data is coming through.
7. Setup the alertmanager service (download page, in-depth installation guide)
8. Setup your alerts. Here are a number of common ones. Copy the ones you would like into your rules.yml file.
  - alert: ZooKeeper server is down
    expr:  up == 0
    for: 1m
    labels:
      severity: critical
    annotations:
      summary: "Instance {{ $labels.instance }} ZooKeeper server is down"
      description: "{{ $labels.instance }} of job {{$labels.job}} ZooKeeper server is down: [{{ $value }}]."

  - alert: create too many znodes
    expr: znode_count > 1000000
    for: 1m
    labels:
      severity: warning
    annotations:
      summary: "Instance {{ $labels.instance }} create too many znodes"
      description: "{{ $labels.instance }} of job {{$labels.job}} create too many znodes: [{{ $value }}]."

  - alert: create too many connections
    expr: num_alive_connections > 50 # suppose we use the default maxClientCnxns: 60
    for: 1m
    labels:
      severity: warning
    annotations:
      summary: "Instance {{ $labels.instance }} create too many connections"
      description: "{{ $labels.instance }} of job {{$labels.job}} create too many connections: [{{ $value }}]."

  - alert: znode total occupied memory is too big
    expr: approximate_data_size /1024 /1024 > 1 * 1024 # more than 1024 MB(1 GB)
    for: 1m
    labels:
      severity: warning
    annotations:
      summary: "Instance {{ $labels.instance }} znode total occupied memory is too big"
      description: "{{ $labels.instance }} of job {{$labels.job}} znode total occupied memory is too big: [{{ $value }}] MB."

  - alert: set too many watch
    expr: watch_count > 10000
    for: 1m
    labels:
      severity: warning
    annotations:
      summary: "Instance {{ $labels.instance }} set too many watch"
      description: "{{ $labels.instance }} of job {{$labels.job}} set too many watch: [{{ $value }}]."

  - alert: a leader election happens
    expr: increase(election_time_count[5m]) > 0
    for: 1m
    labels:
      severity: warning
    annotations:
      summary: "Instance {{ $labels.instance }} a leader election happens"
      description: "{{ $labels.instance }} of job {{$labels.job}} a leader election happens: [{{ $value }}]."

  - alert: open too many files
    expr: open_file_descriptor_count > 300
    for: 1m
    labels:
      severity: warning
    annotations:
      summary: "Instance {{ $labels.instance }} open too many files"
      description: "{{ $labels.instance }} of job {{$labels.job}} open too many files: [{{ $value }}]."

  - alert: fsync time is too long
    expr: rate(fsynctime_sum[1m]) > 100
    for: 1m
    labels:
      severity: warning
    annotations:
      summary: "Instance {{ $labels.instance }} fsync time is too long"
      description: "{{ $labels.instance }} of job {{$labels.job}} fsync time is too long: [{{ $value }}]."

  - alert: take snapshot time is too long
    expr: rate(snapshottime_sum[5m]) > 100
    for: 1m
    labels:
      severity: warning
    annotations:
      summary: "Instance {{ $labels.instance }} take snapshot time is too long"
      description: "{{ $labels.instance }} of job {{$labels.job}} take snapshot time is too long: [{{ $value }}]."

  - alert: avg latency is too high
    expr: avg_latency > 100
    for: 1m
    labels:
      severity: warning
    annotations:
      summary: "Instance {{ $labels.instance }} avg latency is too high"
      description: "{{ $labels.instance }} of job {{$labels.job}} avg latency is too high: [{{ $value }}]."

  - alert: JvmMemoryFillingUp
    expr: jvm_memory_bytes_used / jvm_memory_bytes_max{area="heap"} > 0.8
    for: 5m
    labels:
      severity: warning
    annotations:
      summary: "JVM memory filling up (instance {{ $labels.instance }})"
      description: "JVM memory is filling up (> 80%)\n labels: {{ $labels }}  value = {{ $value }}\n"
9. Install Grafana (download page, in-depth install guide)
10. Add Prometheus data source
					Name:   zookeeper-monitor
Type:   Prometheus
Url:    http://localhost:9090
Access: proxy
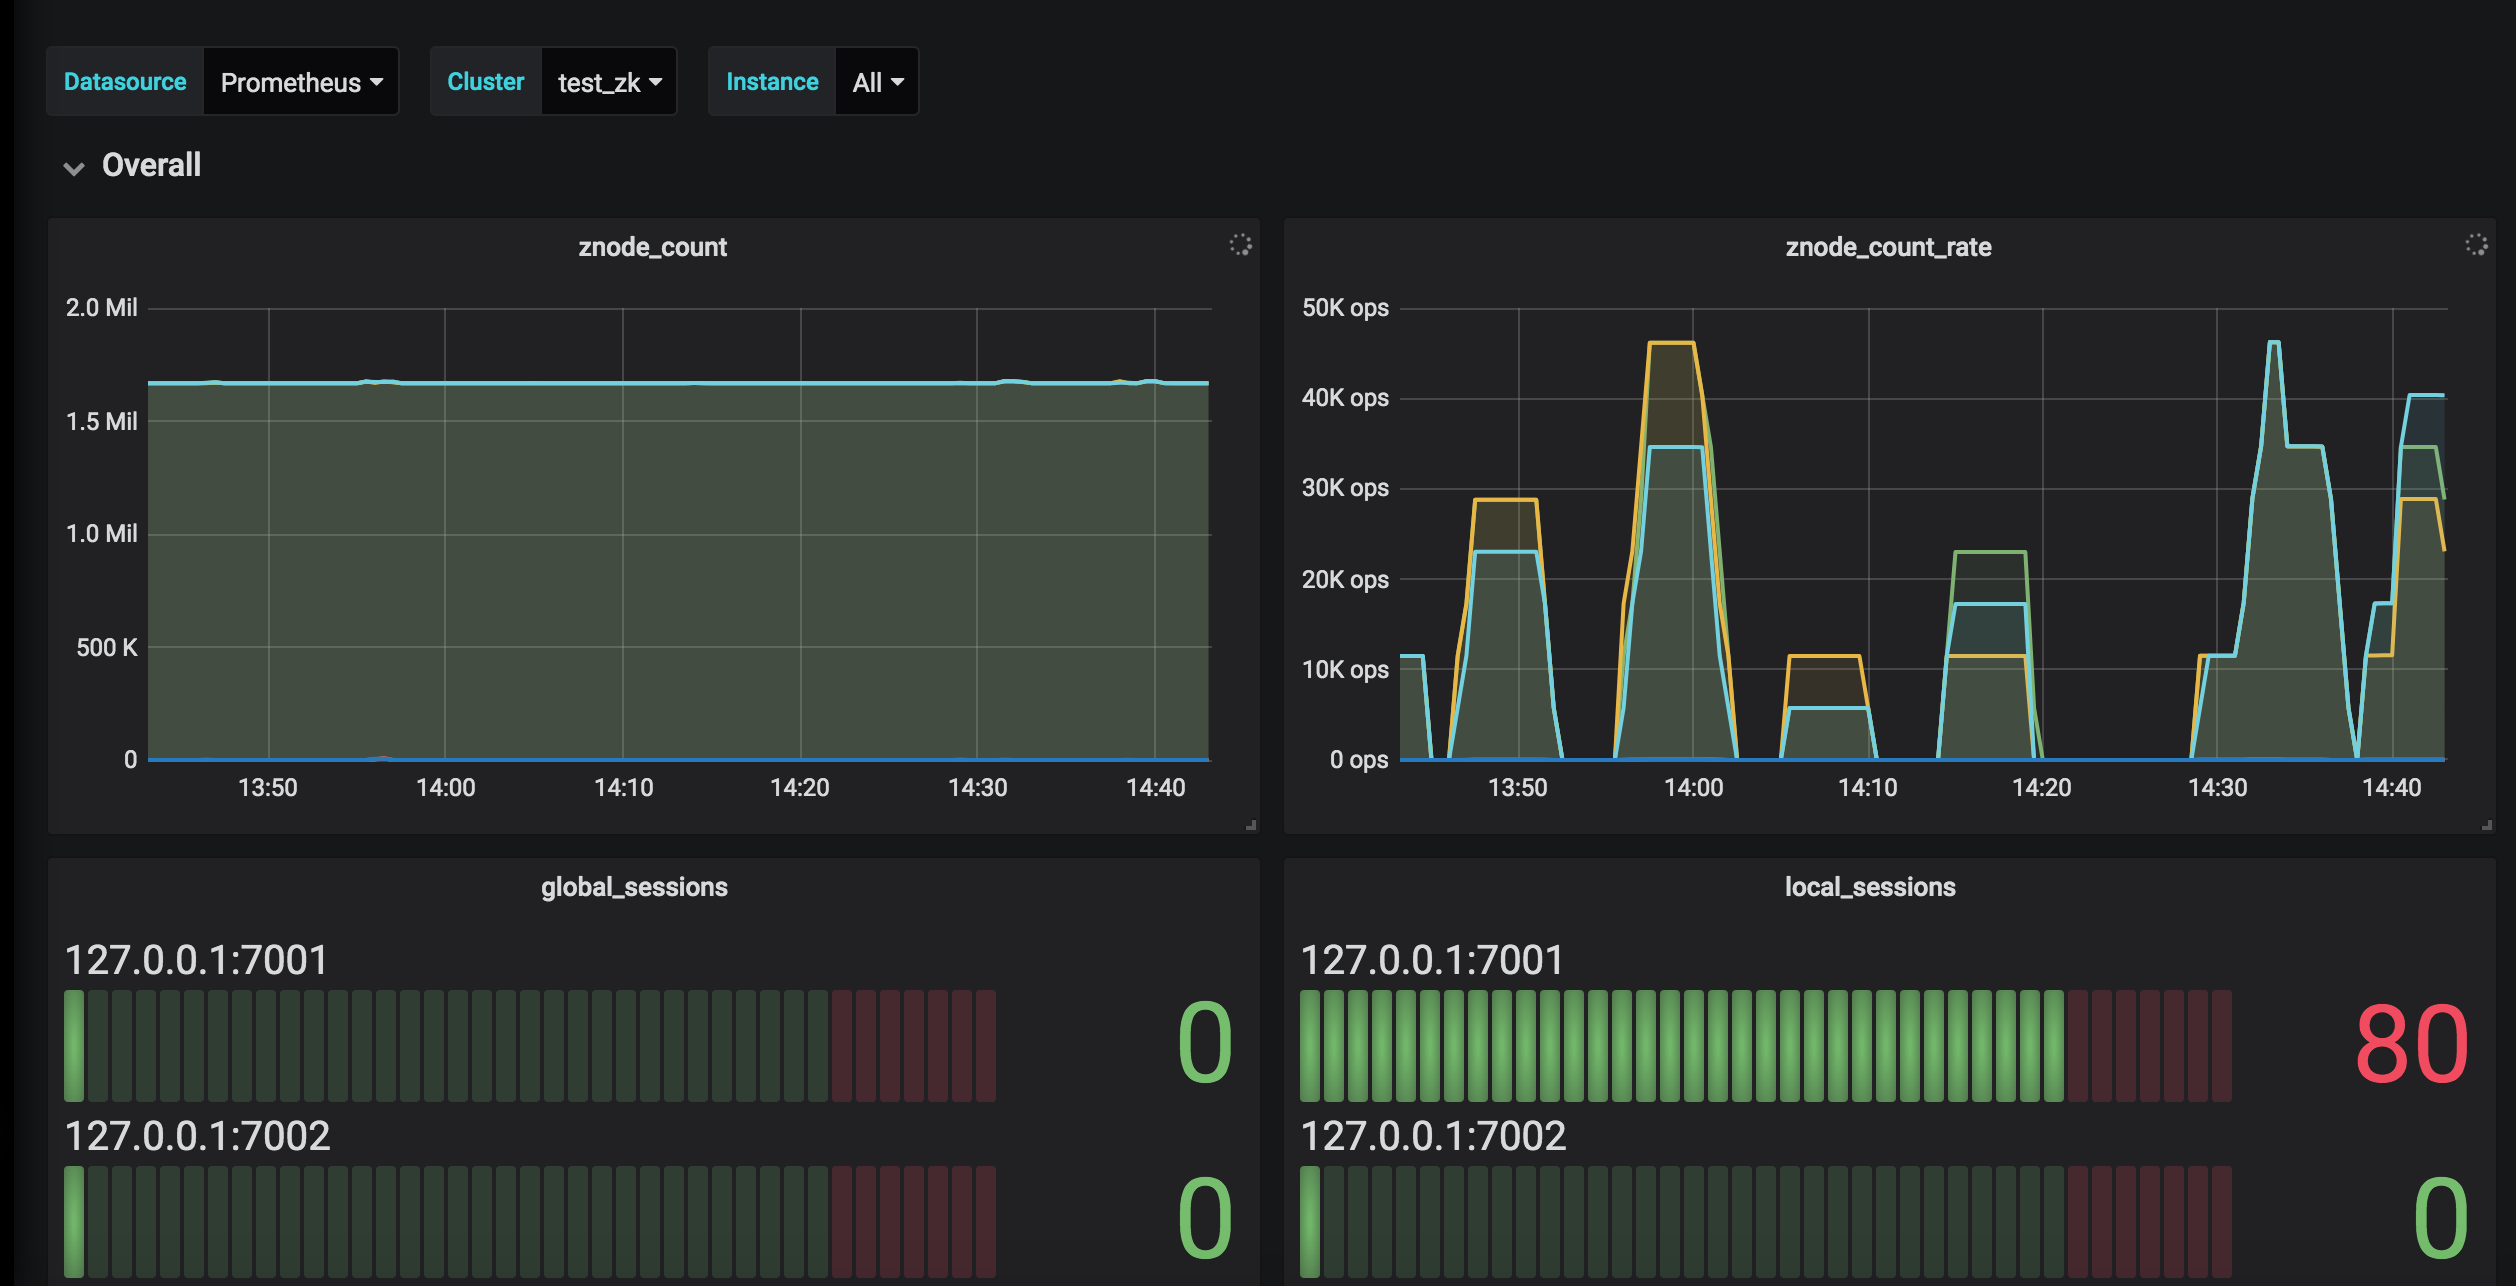
11. Add ZooKeeper Grafana Template